
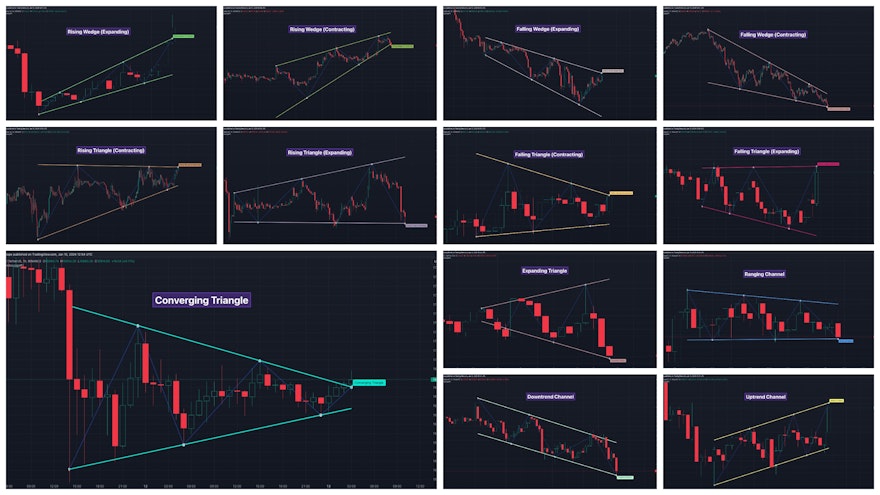
Summary Table for Chart Pattern Classification Rules
This post in relation to our guide on spotting chart patterns on the subject of Chart Patterns
The article only covers the patterns created from the trend line pairs. The following types of patterns are not covered under this article.
- Flag Patterns and Pennants
- Head and Shoulders and the Inverse
- Double top and Double bottom
- Triple Top and Triple bottom
- Cup and Handle and the Inverse
- Rounding Bottom and Top Patterns
The above patterns are not based on the trend line pairs, or they are extension to the trend line pair based patterns that depend on the price movements or the trends prior to the patterns. They will be covered under a different article.
In the current article, we concentrate on the wedge patterns, symmetrical triangles and price channels
Here is a simple table to remember the correlation of recognizable stock chart patterns
| Pattern | Upper Trend Line | Lower Trend Line | Relation between trend Lines |
| Rising Wedge (Contracting) | Rising | Rising | Contacting |
| Rising Wedge (Expanding) | Rising | Rising | Expanding |
| Falling Wedge (Contracting) | Falling | Falling | Contracting |
| Falling Wedge (Expanding) | Falling | Falling | Expanding |
| Converging Triangle | Falling | Rising | Contracting |
| Diverging Triangle | Rising | Falling | Expanding |
| Ascending Triangle (Contracting) | Flat | Rising | Contracting |
| Ascending Triangle (Expanding) | Rising | Flat | Expanding |
| Descending Triangle (Contracting) | Falling | Flat | Contracting |
| Descending Triangle (Expanding) | Flat | Falling | Expanding |
| Uptrend/Ascending Channel | Rising | Rising | Parallel |
| Downtrend/Descending Channel | Falling | Falling | Parallel |
| Ranging Channel | Flat | Flat | Parallel |
Details with Examples of Each Patterns
Once we identify the direction and characteristics of trend lines, we can go on and classify the pattern in following categories.
Rising Wedge (Contracting)
Rules for Contracting Rising Wedge Pattern are as follows:
- Both Trend Lines are Rising
- Trend Lines are converging.

Rising Wedge (Expanding)
Rules for the Expanding Rising Wedge are as follows:
- Both Trend Lines are rising
- Trend Lines are diverging.

Falling Wedge (Contracting)
Rules for the Contracting Falling Wedge are as follows:
- Both Trend Lines are falling
- Trend Lines are contracting.

Falling Wedge (Expanding)
Rules for the Expanding Falling Wedge are as follows:
- Both Trend Lines are falling
- Trend Lines are diverging.

Contracting/Converging Triangle
Rules for the Contracting Triangle are as follows
- The upper trend line is falling
- The lower trend line is rising
- Naturally, the trend lines are converging.

Ascending Triangle (Contracting)
The rules for the Contracting Ascending Triangle are as follows
- The upper trend line is flat
- The lower trend line is rising
- Naturally, the trend lines are converging towards each other

Descending Triangle (Contracting)
The rules for the Contracting Descending Triangle are as follows
- The upper trend line is falling
- The lower trend line is flat
- Naturally, the trend lines are converging towards each other

Expanding/Diverging Triangle
Rules for the Diverging Triangle are as follows
- The upper trend line is rising
- The lower trend line is falling
- Naturally, the trend lines are diverging from each other.

Ascending Triangle (Expanding)
The rules for the Expanding Ascending Triangle are as follows
- The upper trend line is rising
- The lower trend line is flat
- Naturally, the trend lines are diverging from each other

Descending Triangle (Expanding)
The rules for the Expanding Descending Triangle are as follows
- The upper trend line is flat
- The lower trend line is falling
- Naturally, the trend lines are diverging from each other

Ascending/Uptrend Channel
Rules for the Ascending Channel are as follows
- Both trend lines are rising
- Trend lines are parallel to each other

Descending/Downtrend Channel
Rules for the Descending Channel are as follows
- Both trend lines are falling
- Trend lines are parallel to each other

Ranging Channel
Rules for the Ranging Channel are as follows:
- Both trend lines are flat
- Naturally, the trend lines are parallel to each other.

How reliable are chart patterns in predicting future price movements?
Chart patterns are a valuable tool used by technical traders and investors to analyze and predict future price movements in the financial markets. They can provide valuable insights into market dynamics and help identify potential trading opportunities.
While it is important to understand that chart patterns are not foolproof and do not guarantee accurate predictions, they can offer meaningful indications of price direction and potential market trends.
Chart patterns are formed by the price movements of a financial instrument over a specific period of time. These patterns can take different forms, such as triangles, head and shoulders, double tops, and many others. Traders and analysts study these patterns to identify potential support and resistance levels, trend reversals, and market sentiment.
The reliability of chart patterns in predicting future price movements depends on various factors. One crucial aspect is the timeframe in which the pattern is observed. Patterns that occur on longer timeframes, such as weekly or monthly charts, tend to be more reliable and carry more weight compared to those formed on shorter timeframes.
Additionally, the strength and validity of a chart pattern can be influenced by the volume and liquidity of the market. Patterns that form with high trading volumes and in highly liquid markets are generally considered more reliable.
Another factor to consider is the historical accuracy of specific chart patterns. Certain patterns, such as the double top or head and shoulders, have demonstrated a higher level of reliability over time. Traders often rely on these well-established patterns because they tend to have a consistent impact on price movements.
However, market conditions and dynamics can change, and chart patterns are not immune to false signals or unexpected price movements. Therefore, it is crucial for traders to incorporate other technical indicators, fundamental analysis, and risk management strategies in their decision-making process.
In conclusion, while chart patterns can provide valuable insights into future price movements, they should not be relied upon as the sole basis for trading decisions. Traders and investors should use chart patterns in conjunction with other analytical tools and strategies to enhance their understanding and increase the probability of successful trading outcomes.
Can chart patterns be used as a standalone trading strategy?
While chart patterns can be a useful tool for technical traders and investors, relying solely on them as a standalone trading strategy may not be the most prudent approach.
Chart patterns, such as head and shoulders, double tops and bottoms, triangles, and flags, provide insights into potential future price movements based on historical price patterns. They can help identify potential trend reversals, continuation patterns, and support and resistance levels.
However, it is important to note that chart patterns are not foolproof indicators. Market dynamics can change, and other factors, such as economic news, geopolitical events, and market sentiment, can greatly impact price movements. Chart patterns should be used in conjunction with other technical analysis tools and indicators to gain a more comprehensive view of the market.
For instance, traders may use chart patterns to identify potential entry and exit points for a trade, but they may also consider other factors, such as volume, moving averages, and oscillators, to confirm the validity of the pattern and assess the overall market conditions.
In addition, understanding the psychology behind chart patterns is crucial. Market participants often react to certain patterns in a predictable manner, and recognizing these behavioral tendencies can enhance the effectiveness of chart pattern analysis. Traders should be aware of false breakouts and take into account the overall market context before making trading decisions solely based on chart patterns.
Ultimately, successful trading strategies are built on a combination of technical and fundamental analysis, risk management, and a deep understanding of market dynamics. While chart patterns can be a valuable tool in the trader's toolbox, they should be used in conjunction with a holistic approach to trading rather than relying on them as the sole basis for trading decisions.
Free Indicators on Chart Patterns
Here are some of our free and popular indicators on the subject of Chart Patterns
Auto Chart Patterns - Free Version
Our Auto Chart Patterns indicator stands as the epitome of advanced chart pattern recognition technology. Building upon our recent publication on algorithmic identification and classification of chart patterns, this tool embodies our innovative approach, automating the intricate process of pattern recognition for traders.
This algorithm tries to capture chart pattern by drawing trend line pairs for lower and higher pivots. The algorithm is so powerful that it can capture many well-known pattern such as converging and diverging triangles, rising and falling wedges, flags, trend and range channels etc.
There are several implementations of ABC pattern in tradingview and pine script. However, we have made this indicator to provide users additional quantifiable information along with flexibility to experiment and develop their own strategy based on the patterns.
The Wolfe wave indicator is a very popular chart pattern used in options trading. The indicator spots the Wolfe formations and also suggests the rules of the Wolfe wave trading system.
Multi Zigzag Wedge and Flag Finder
Most sophisticated Chart Pattern Indicator you will ever find in the open source library of Tradingview. This indicator uses an advanced multi-zigzag algorithm to spot 5 or 6 pivot chart patterns. This is an earlier version of the Chart Patterns (Deep Search) Indicator
Automatically draw trend lines based on historical price action. Gives headstart for users for drawign trend lines. Useful tool for both experienced and new traders who use trend lines as their trading tool.
The indicator automatically draws pitchfork formations on a recursive zigzag. This algorithm is developed using the latest features of Pinescript of using methods and types. The script has the option to select different categories of pitchforks to be drawn. Popular types include Andrew's pitchfork, Schiff and Modified Schiff pitchforks. These can be further drawn as either regular or inside pitchforks.
Recursive Reversal Chart Patterns
An advanced technical indicator that scans for reversal chart patterns - Double Tap, Triple Tap, Cup and Handle, Head and Shoulder patterns
Consolidation Range Tracker is an innovative indicator designed for identifying and tracking price consolidation zones following impulsive moves.
The Volume Forks Indicator is a comprehensive research tool that combines two innovative techniques, Recursive Auto-Pitchfork and Angled Volume Profile. This indicator provides traders with valuable insights into price dynamics by integrating accurate pitchfork drawing and volume analysis over angled levels.
Are you a firm believer in the predictability of historical patterns guiding market trends? If so, this indicator is tailor-made for you.
Free Indicators on Harmonic Patterns
At Trendoscope, we specialise in design and development of indicators on Harmonic Patterns. Here are some of our indicators on the concepts of Harmonic Patterns.
Auto Harmonic Patterns - Extreme
Auto Harmonic Patterns Extreme indicator is the most advanced free tool available for identifying harmonic patterns in the market. Developed by our team of expert traders and programmers, this indicator uses sophisticated algorithms to scan the market and identify key patterns such as the Butterfly, Gartley, Crab, and Bat patterns.
A very good tool for those who are learning Harmonic Patterns. Makes use of Tradingview's interactive input feature which lets the user select the pivots manually and the indicator will highlight if there are any harmonic patterns in the price action. Makes use of the same libraries as our premium Harmonic Pattern indicators.
Interactive Harmonic Pattern Projection
Similar to Manual Harmonic Patterns but instead of notifying patterns on XABCD pivots, this indicator requests users to select the first 4 pivots XABC and then projects the 5th pivot areas for possible harmonic patterns.
Harmonic Pattern Based Trend Follower
One of the innovative concepts that combine trend following and reversals. This indicator tries to define trends based on harmonic pattern price action.
Harmonic Pattern Based Supertrend
When we talk about Trend Following, we cannot ignore supertrend. Supertrend is one of the most popular trend-following technical indicators. Generally, supertrend is derived by ATR-based stops. In this adventure, we try to derive supertrend based on harmonic patterns reversal levels.