
Expanding on TrendLine Pair-Based Chart Patterns
After exploring Algorithmic Identification and Classification of Chart Patterns, we now delve into extensions of these patterns, focusing on Flag and Pennant Chart Patterns. These patterns evolve from basic trend line pair-based structures, often influenced by preceding market impulses, and they make very significant patterns in the world of technical analysis. These patterns can be identified in any instruments such as crypto, forex (currencies), commodities, stocks etc and can be found in any timeframes ranging from intraday minute level to daily and weekly price charts.
Identification rules for the Extension Patterns
Identify the existence of Base Chart Patterns
Before diving into Flag and Pennant patterns, it's crucial to recognize the foundational base patterns:
- Ascending Channel Chart Pattern - Uptrending parallel trendlines constitute ascending channel chart pattern
- Descending Channel Chart Pattern - Results from down trending parallel trendlines
- Rising Wedge Chart Pattern - Both trend lines are ascending however, the slopes of trend lines are not equal. They are either converging or diverging from each other
- Falling Wedge Chart Pattern - Both trend lines are descending however, the slopes of trend lines are not equal. They are either converging or diverging from each other
- Converging Triangle (Symmetrical Triangle Chart Pattern) - Trend Lines converge towards each other and upper trend line will be in downward slope whereas the lower trendline will be in upward slope.
- Falling Triangle Chart Pattern - Triangle formed by one of the trendline in downward direction whereas the other is flat
- Rising Triangle Chart Pattern - Triangle formed by one of the trendline in upward direction whereas the other is flat
These form the backdrop against which Flags and Pennants develop, often emerging after a sharp, directional market move.
Formation of Extension Patterns
The key to pinpointing these patterns lies in spotting a strong impulsive wave – akin to a flagpole – preceding a base pattern. This setup suggests potential for an extension pattern:
- A Bull Flag emerges from a positive impulse followed by a descending channel or a falling wedge.
- A Bear Flag appears after a negative impulse leading to an ascending channel or a rising wedge.
- A Bullish Pennant is indicated by a positive thrust preceding a converging triangle or ascending triangle.
- A Bearish Pennant follows a negative impulse and a converging or descending triangle.
Pattern Classifications and Characteristics
Bullish Flag Pattern
Characteristics of Bullish Flag Pattern are as follows
- Starts with a positive impulse wave
- Immediately followed by either a short descending channel or a falling wedge
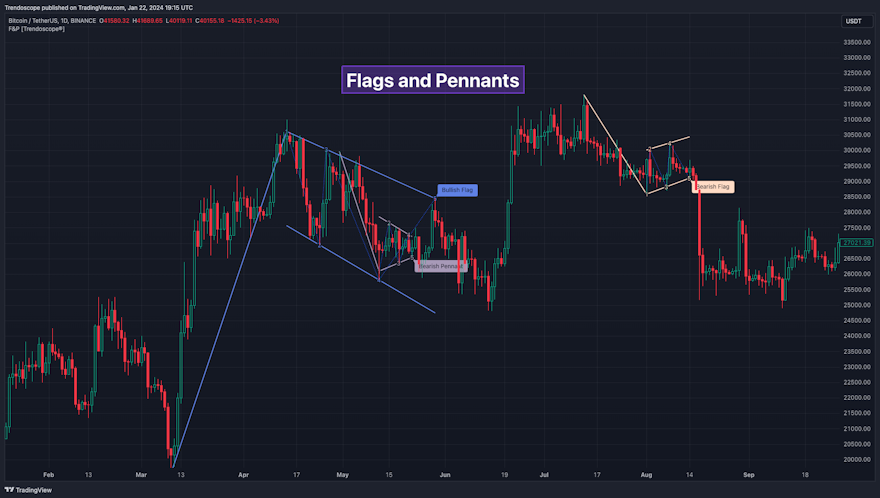
Here is an example of Bullish Flag Pattern

Bearish Flag Pattern
Characteristics of Bearish Flag Pattern are as follows
- Starts with a negative impulse wave
- Immediately followed by either a short ascending channel or a rising wedge
Here is an example of Bearish Flag Pattern

Bullish Pennant Pattern
Characteristics of Bullish Pennant Pattern are as follows
- Starts with a positive impulse wave
- Immediately followed by either a converging triangle or ascending triangle pattern.
Here is an example of Bullish Pennant Pattern

Bearish Pennant Pattern
Characteristics of Bearish Pennant Pattern are as follows
- Starts with a negative impulse wave
- Immediately followed by either a converging triangle or a descending converging triangle pattern.
Here is an example of Bearish Pennant Pattern

Trading Extension Patterns
In a strong market trend, it's common to see temporary periods of consolidation, forming patterns that either converge or range, often counter to the ongoing trend direction. Such pauses may lay the groundwork for the continuation of the trend post-breakouts. The assumption that the trend will resume shapes the underlying bias of Flag and Pennant patterns, and hence the previous trend will play an important role in identifying the directions of patterns.
It's important, however, not to base decisions solely on past trends. Conducting personal back testing is crucial to ascertain the most effective entry and exit strategies for these patterns. Remember, the behavior of these patterns can vary significantly with the volatility of the asset and the specific timeframe being analyzed.
Approach the interpretation of these patterns with prudence, considering that market dynamics are subject to a wide array of influencing factors that might deviate from expected outcomes. For investors and traders, it's essential to engage in thorough back testing, establishing entry points, stop-loss orders, and target goals that align with your individual trading style and risk appetite. This step is key to assessing the viability of these patterns in line with your personal trading strategies and goals.
We can also be innovative and trade against the bias when breakout happens in opposite direction.
Cheat Sheet
| Impulse Direction (Flag Pole) | Base Pattern | Resulting Extension Pattern |
| Bullish Impulse | Descending Channel Falling Wedge | Bullish Flag |
| Bearish Impulse | Ascending Channel Rising Wedge | Bearish Flag |
| Bullish Impulse | Converging Triangle Ascending Triangle (Converging) | Bullish Pennant |
| Bearish Impulse | Converging Triangle Descending Triangle (Converging) | Bearish Pennant |
Supporting Indicators
Here are some of our free and popular indicators on the subject of Chart Patterns
In the dynamic world of trading, the Flags and Pennants indicator stands as a pivotal tool for traders looking to navigate market trends with precision. This indicator is designed to identify and illustrate key continuation patterns – Flags and Pennants – which are vital for recognizing short-term pauses within strong trends
Auto Chart Patterns - Free Version
Our Auto Chart Patterns indicator stands as the epitome of advanced chart pattern recognition technology. Building upon our recent publication on algorithmic identification and classification of chart patterns, this tool embodies our innovative approach, automating the intricate process of pattern recognition for traders.