
Mastering Chart Patterns: The Ultimate Guide to Technical Analysis
Welcome to the ultimate guide to mastering chart patterns and technical analysis. Whether you're a seasoned investor or just starting out in the world of trading, understanding chart patterns is a crucial skill that can greatly enhance your decision-making process. In this comprehensive guide, we will dive deep into the different types of chart patterns, how to identify them, and most importantly, how to use them to your advantage. From the classic double tops and double bottoms to the more complex head and shoulders patterns, we will break down each pattern step by step, providing you with clear explanations and real-life examples. But it doesn't stop there. We will also explore the principles of technical analysis, including support and resistance levels, trend lines, and volume analysis, giving you the tools you need to make informed and profitable trades. So, get ready to take your trading game to the next level as we demystify chart patterns and unlock the secrets of technical analysis.
Understanding Chart Patterns
Chart patterns are visual representations of market behaviour that can help traders identify potential price movements. By analysing historical price data, chart patterns provide valuable insights into market psychology and can predict future price trends. Understanding chart patterns is the foundation of technical analysis and is essential for successful trading. There are various types of chart patterns, each with its own characteristics and implications. In this section, we will explore the different types of chart patterns and their significance in the market.
When it comes to chart patterns, there are two main categories: trend continuation patterns and reversal chart patterns. Trend continuation patterns indicate that the current trend is likely to continue, while reversal chart patterns suggest that the trend is about to change. Both types of patterns can provide valuable trading opportunities, but it's important to understand their characteristics and how to interpret them correctly.
Types of Chart Patterns
Trend Continuation Patterns
Trend continuation patterns occur during an ongoing trend and indicate that the market is taking a breather before resuming its previous direction. These patterns typically suggest that the buying or selling pressure that caused the trend is still present and that the market is simply consolidating before making its next move. The most common trend continuation patterns include flags, pennants.
A flag pattern is characterised by a strong, vertical price movement (the flagpole) followed by a period of consolidation (the flag). The flag is usually a rectangular or parallelogram-shaped formation that moves against the prevailing trend. Once the consolidation is complete, the price tends to break out in the direction of the original trend, signalling a continuation of the previous move.
Pennants are similar to flag patterns but have a triangular shape. They are formed when the price consolidates within converging trend lines, creating a small symmetrical triangle. The breakout from a pennant pattern is typically accompanied by a surge in trading volume and indicates a continuation of the preceding trend.
Reversal Chart Patterns
Reversal chart patterns, as the name suggests, indicate that the current trend is about to reverse. These patterns are formed when the price reaches a point of exhaustion, signalling that the balance between buyers and sellers is shifting. Reversal patterns can provide early indications of trend reversals and offer significant profit potential if traded correctly. Some common reversal chart patterns include double tops, double bottoms, head and shoulders, cup and handle, and inverse head and shoulders and inverse cup and handle.
Double tops and double bottoms are reversal patterns that occur after an extended uptrend or downtrend, respectively. In a double-top pattern, the price reaches a high level, retraces, and then rallies again but fails to exceed the previous high. This failure to break the previous high indicates a loss of bullish momentum and often leads to a trend reversal. Conversely, in a double-bottom pattern, the price reaches a low level, bounces back, and then declines again but fails to break the previous low. This failure to break the previous low suggests a loss of bearish momentum and signals a potential trend reversal.
Breakout Chart Patterns
Breakout chart patterns are bi-directional. Breakout chart patterns are technical analysis formations that occur when the price of an asset breaks out of a defined price range or pattern. These patterns are commonly used by traders to identify potential opportunities for entering or exiting trades.
A breakout occurs when the price of an asset moves above a resistance level or below a support level, indicating a potential shift in the market sentiment and the possibility of a significant price movement. Breakouts can signify the end of a consolidation phase and the beginning of a new trend or continuation of an existing trend.
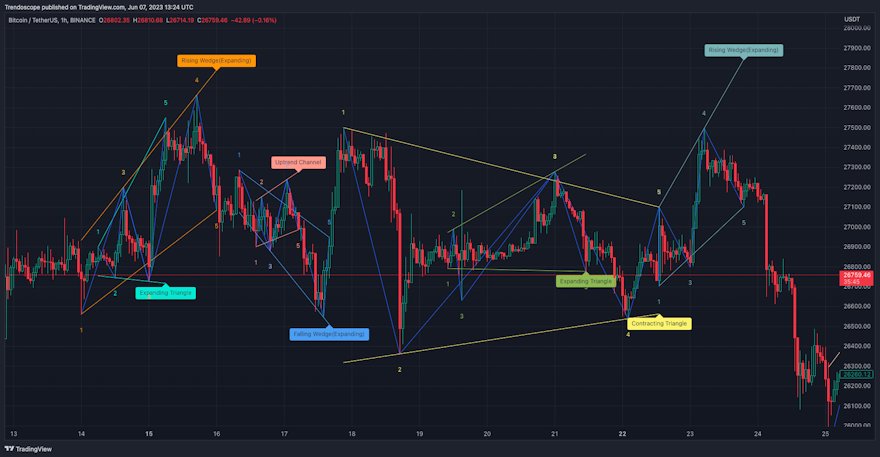
There are several common types of breakout chart patterns, including Triangles, Wedges and Channels. These can further be classified as Symmetrical Triangle, Ascending and Descending Triangles, Rising and Falling Wedges, and Bullish, Bearish and Ranging Channels. The ranging channel can also be termed as Rectangle.
Generally, Rising Wedges are considered bearish and Falling Wedges as bullish. But, according to our study based on Objective methods, breakout patterns behave in a non-directional way until the breakouts occur.
Harmonic Chart Patterns
Harmonic patterns are specific price formations in financial markets that are believed to have predictive value for potential trend reversals or continuation. They are based on geometric price relationships and ratios derived from Fibonacci numbers.
Harmonic patterns are named after various geometric shapes, popular ones are:
- Gartley
- Crab
- DeepCrab
- Bat
- Butterfly
- Shark
- Cypher
- 5-0
- Three Drives
- White Swan
- Black Swan
- 121
Each pattern has specific criteria and ratios that traders look for to identify potential trading opportunities.
The key idea behind harmonic patterns is that price movements exhibit repetitive patterns that can be measured and projected. These patterns consist of specific retracement and extension levels that align with Fibonacci ratios, such as 0.382, 0.500, 0.618, and their extensions like 1.272 and 1.618.
Traders who employ harmonic pattern analysis search for specific price structures that conform to the defined ratios. Once a potential harmonic pattern is identified, traders can project price targets and define entry, stop-loss, and take-profit levels based on the expected price movement.
Harmonic patterns are often visualised using lines or ratios on price charts, making it easier for traders to identify and interpret them. Advanced trading platforms and charting software may also provide automated tools for detecting and drawing harmonic patterns.
Using Chart Patterns in Trading Decisions
Now that we have covered the different types of chart patterns, let's explore how to use them in making trading decisions. Chart patterns alone are not enough to guarantee profitable trades, but when combined with other technical analysis tools and indicators, they can significantly improve your trading success rate. Here are some key points to consider when using chart patterns in your trading strategy:
- Confirmation: Before entering a trade based on a chart pattern, it's essential to wait for confirmation. This may include a breakout above or below a specific level, a certain volume pattern, or the confirmation of other indicators. Confirming the validity of a pattern reduces the risk of false signals and increases the chances of a successful trade.
- Timeframe: Chart patterns can vary in their timeframes, ranging from intraday patterns that form within minutes to longer-term patterns that develop over weeks or months. It's important to consider the timeframe you are trading and adjust your strategy accordingly. Shorter-term patterns may be more suitable for day traders, while longer-term patterns may be more relevant for swing or position traders.
- Risk Management: Proper risk management is crucial when trading chart patterns. Set clear stop-loss levels to limit potential losses and consider the risk-to-reward ratio before entering a trade. Remember that not all patterns will result in successful trades, so it's important to have a risk management plan in place to protect your capital.
- Backtesting and Practice: Like any trading strategy, using chart patterns requires practice and refinement. Conducting backtests on historical data can help you evaluate the performance of different patterns and identify their strengths and weaknesses. Consider using a demo trading account to practice implementing chart patterns in real-market conditions before risking real money.
By incorporating these considerations into your trading strategy, you can increase your chances of success when using chart patterns to make trading decisions.
Common Mistakes to Avoid in Chart Pattern Analysis
While chart patterns can be powerful tools for traders, there are common mistakes that can hinder their effectiveness. Understanding these pitfalls can help you avoid costly errors and improve your chart pattern analysis. Here are some common mistakes to avoid:
- Overlooking Context: Chart patterns should never be analyzed in isolation. It's essential to consider the broader market context, including trend direction, support and resistance levels, and market sentiment. Ignoring the bigger picture can lead to false signals and missed opportunities.
- Ignoring Volume Analysis: Volume is an important indicator that can validate or invalidate the significance of a chart pattern. High volume during a breakout or breakdown confirms the strength of the pattern, while low volume may indicate a lack of conviction. Incorporate volume analysis into your chart pattern analysis to increase its accuracy.
- Chasing Trades: FOMO (fear of missing out) can be a trader's worst enemy. It's tempting to chase trades based on chart patterns that have already formed, but this can lead to entering trades too late and missing out on the best entry points. Be patient and wait for proper confirmation before entering a trade.
- Neglecting Risk Management: Risk management is crucial in trading, and chart pattern analysis is no exception. Always set stop-loss orders to limit potential losses and stick to your risk management plan. Failing to manage risk properly can result in significant losses and negatively impact your trading account.
By avoiding these common mistakes, you can enhance the effectiveness of your chart pattern analysis and increase your trading success.
Chart Pattern Recognition Tools and Software
Analysing chart patterns manually can be time-consuming and prone to human error. Fortunately, there are numerous chart pattern recognition tools and software available that can automate the process and provide real-time alerts when patterns emerge. These tools use advanced algorithms to scan price charts and identify patterns based on predefined criteria.
When choosing a chart pattern recognition tool or software, consider the following factors:
- Accuracy: Look for tools that have a high accuracy rate in identifying chart patterns. Read user reviews and testimonials to gauge the reliability of the tool.
- Customization: Ensure that the tool allows you to customize the critera for pattern identification. This will enable you to focus on specific patterns that align with your trading strategy.
- Real-time alerts: Real-time alerts are crucial for timely trade execution. Choose a tool that provides instant notifications when a pattern is detected, so you can take advantage of trading opportunities as soon as they arise.
- User-friendly interface: The tool should have an intuitive and user-friendly interface that allows you to analyse patterns easily and efficiently. Look for tools that offer features like zooming, drawing tools, and customisable chart layouts.
Developing a Chart Pattern Trading Strategy
To maximise the effectiveness of chart patterns in your trading, it's crucial to develop a well-defined trading strategy. A trading strategy outlines the rules and guidelines you will follow when analysing and trading chart patterns. Here are some key steps to consider when developing your chart pattern trading strategy:
- Define your goals and risk tolerance: Determine your trading goals, whether they are short-term profits or long-term wealth accumulation. Assess your risk tolerance and set realistic expectations for your trading performance.
- Identify the chart patterns you will trade: Based on your preferred trading style and timeframe, choose the chart patterns that you will focus on. Consider the patterns that align with your risk tolerance and have a high probability of success.
- Set criteria for pattern identification: Define the specific criteria you will use to identify chart patterns. This may include price levels, volume patterns, candlestick formations, or other technical indicators. Be consistent in your approach to ensure accurate pattern identification.
- Determine entry and exit strategies: Define the entry and exit rules for your trades. This may include specific price levels, confirmation signals, trailing stops, or profit targets. Having clear rules for entry and exit will help you make objective trading decisions and avoid emotional biases.
- Test and refine your strategy: Backtest your trading strategy using historical data to assess its performance. Make adjustments as necessary and refine your strategy based on the results. Consider using a demo trading account to practice implementing your strategy in real-market conditions.
- Stick to your strategy: Once you have developed and tested your trading strategy, it's crucial to stick to it consistently. Avoid making impulsive decisions based on emotions or market noise. Trust in the rules and guidelines you have set for yourself.
By developing a well-defined chart pattern trading strategy, you can increase your chances of success and improve your overall trading performance.
Free Indicators on Chart Patterns
Here are some of our free and popular indicators on the subject of Chart Patterns
Auto Chart Patterns - Free Version
Our Auto Chart Patterns indicator stands as the epitome of advanced chart pattern recognition technology. Building upon our recent publication on algorithmic identification and classification of chart patterns, this tool embodies our innovative approach, automating the intricate process of pattern recognition for traders.
This algorithm tries to capture chart pattern by drawing trend line pairs for lower and higher pivots. The algorithm is so powerful that it can capture many well-known pattern such as converging and diverging triangles, rising and falling wedges, flags, trend and range channels etc.
There are several implementations of ABC pattern in tradingview and pine script. However, we have made this indicator to provide users additional quantifiable information along with flexibility to experiment and develop their own strategy based on the patterns.
The Wolfe wave indicator is a very popular chart pattern used in options trading. The indicator spots the Wolfe formations and also suggests the rules of the Wolfe wave trading system.
Multi Zigzag Wedge and Flag Finder
Most sophisticated Chart Pattern Indicator you will ever find in the open source library of Tradingview. This indicator uses an advanced multi-zigzag algorithm to spot 5 or 6 pivot chart patterns. This is an earlier version of the Chart Patterns (Deep Search) Indicator
Automatically draw trend lines based on historical price action. Gives headstart for users for drawign trend lines. Useful tool for both experienced and new traders who use trend lines as their trading tool.
The indicator automatically draws pitchfork formations on a recursive zigzag. This algorithm is developed using the latest features of Pinescript of using methods and types. The script has the option to select different categories of pitchforks to be drawn. Popular types include Andrew's pitchfork, Schiff and Modified Schiff pitchforks. These can be further drawn as either regular or inside pitchforks.
Recursive Reversal Chart Patterns
An advanced technical indicator that scans for reversal chart patterns - Double Tap, Triple Tap, Cup and Handle, Head and Shoulder patterns
Consolidation Range Tracker is an innovative indicator designed for identifying and tracking price consolidation zones following impulsive moves.
The Volume Forks Indicator is a comprehensive research tool that combines two innovative techniques, Recursive Auto-Pitchfork and Angled Volume Profile. This indicator provides traders with valuable insights into price dynamics by integrating accurate pitchfork drawing and volume analysis over angled levels.
Are you a firm believer in the predictability of historical patterns guiding market trends? If so, this indicator is tailor-made for you.
Free Indicators on Harmonic Patterns
At Trendoscope, we specialise in design and development of indicators on Harmonic Patterns. Here are some of our indicators on the concepts of Harmonic Patterns.
Auto Harmonic Patterns - Extreme
Auto Harmonic Patterns Extreme indicator is the most advanced free tool available for identifying harmonic patterns in the market. Developed by our team of expert traders and programmers, this indicator uses sophisticated algorithms to scan the market and identify key patterns such as the Butterfly, Gartley, Crab, and Bat patterns.
A very good tool for those who are learning Harmonic Patterns. Makes use of Tradingview's interactive input feature which lets the user select the pivots manually and the indicator will highlight if there are any harmonic patterns in the price action. Makes use of the same libraries as our premium Harmonic Pattern indicators.
Interactive Harmonic Pattern Projection
Similar to Manual Harmonic Patterns but instead of notifying patterns on XABCD pivots, this indicator requests users to select the first 4 pivots XABC and then projects the 5th pivot areas for possible harmonic patterns.
Harmonic Pattern Based Trend Follower
One of the innovative concepts that combine trend following and reversals. This indicator tries to define trends based on harmonic pattern price action.
Harmonic Pattern Based Supertrend
When we talk about Trend Following, we cannot ignore supertrend. Supertrend is one of the most popular trend-following technical indicators. Generally, supertrend is derived by ATR-based stops. In this adventure, we try to derive supertrend based on harmonic patterns reversal levels.