
We discussed identification and classification of different chart patterns and chart pattern extensions in our previous posts.
Now, this section is dedicated to the methods of trading some of these patterns. Since, the rules of trade cannot be same for all patterns, we are choosing only converging type of patterns to start with.
This includes the patterns
- Rising Wedge (Converging Type)
- Falling Wedge (Converging Type)
- Converging Triangle or Symmetrical Triangle
- Rising Triangle (Converging Type)
- Falling Triangle (Converging Type)
Historical Bias and General Perception
Each of these patterns has historic bias that most of the people believe as the right way to trade. Let's learn about the historical bias and general perception before discussing our methods.
Contracting Wedge Patterns
Contracting Wedges often represent diagonal waves of Elliott Wave Structure. And contracting wedges can be either leading or ending diagonal waves. If the contracting wedge is part of a leading diagonal, it may face short term pullback before continuing the trend. If the patter is part of an ending diagonal wave, this may signify the end of wave 5 or C and hence we may look for long term reversals.
In either case, general perception is a short term reversal. That means, a rising wedge is considered bearish whereas a Falling Wedge is considered bullish.
We also need to keep in mind that the trend previous to pattern formation plays an important role in identifying whether the structure is part of wave 1, A, 5 or C. For example, a falling wedge pattern in uptrends will have different expected risk reward than that appearing in downtrends
More details are mentioned in the article - Decoding Wedge Patterns
Rising Wedge (Converging Type)
Historical bias on the Rising Wedge Chart Pattern is that it is bearish in nature. So, the general perception here is that the right way to trade a rising wedge is when it breaks down the lower trend line.

Falling Wedge (Converging Type)
Similarly, the historical bias on the Falling Wedge Chart Pattern is that it is bullish in nature and the right way to trade is to go long when it breaks above the upper trend line.

Contracting Triangle Patterns
Contracting Triangle types such as Converging Triangle, Ascending or Descending Triangles when fall into the Wave B or Wave 2 of Elliott wave are considered to continue in the direction of trend previous to the formation of pattern.
This also the basis for Pennant Pattern where the triangle structure is formed post an impulse wave.

Alternate Way of Looking into Patterns
Main issue with historical perception are:
- There is no clear back testing data to prove whether the general perception is correct or more profitable.
- Elliott Waves concepts are very much subjective and can be often difficult for beginners and misleading even for experts.
So, the alternative way is to treat all the converging patterns equally and devise a method to trade using a universal way. This allows us to back test our thesis and be definitive about the profitability of these patterns.
Here are our simple steps to devise and test a converging pattern based strategy.
- Consider all converging patterns as bidirectional. Meaning, they can be traded on either side. Thus chose to trade based on the breakout. If the price beaks up, then trade long and if the price breaks down, then trade short.
- For each direction, define criteria for entry, stop, target prices and also an invalidation price at which the trade is ignored even without entry.
- Backtest and Forward test the strategy and collect data with respect to win ratio, risk reward and profit factor to understand the profitability of patterns and the methodology. Now, let's break it further down.
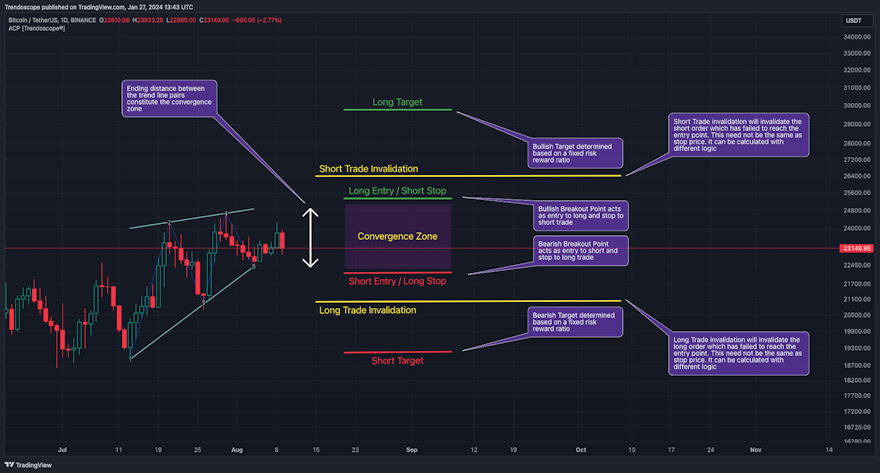
Defining The Pattern Trade Conditions
Measure the ending distance between the trend line pairs and set breakout points above and beyond the convergence zone.
Entry Points - These can be formed on the either side of the convergence zone. Adding a small buffer on top of the convergence zone is ideal for setting the entry points of converging patterns.
Formula for Entry can be:
Long Entry Price = Top + (Top - Bottom) X Entry Ratio
Short Entry Price = Bottom - (Top-Bottom) X Entry Ratio
Whereas Top refers to the upper side of the convergence zone and bottom refers to the lower side of the convergence zone. Entry Ratio is the buffer ratio to apply on top of the convergence zone to get entry points.
Stop Price - Long entry can act as stop for short orders and the short entry can act as stop price for long orders. However, this is not mandatory and different logic for stops can be applied for both sides.
Formula for Stop Can be
Long Stop Price = Bottom - (Top - Bottom) X Stop Ratio
Short Stop Price = Top + (Top - Bottom) X Stop Ratio
Target Price - It is always good to set targets based on desired risk reward ratio. That means, the target should always depend on the distance between entry and stop price.
The general formula for Target can be:
Target Price = Entry + (Entry-Stop) X Risk Reward
Invalidation Price - Invalidation price is a level where the trade direction for a particular pattern needs to be ignored or invalidated. This price need to be beyond stop price. In general, trade is closed when a pattern hits invalidation price.
Formula for Invalidation price is the same as that of Stop Price, but Invalidation Ratio is more than that of Stop Ratio
Long Invalidation Price = Bottom - (Top - Bottom) X Invalidation Ratio
Short Invalidation Price = Top + (Top - Bottom) X Invalidation Ratio

Back Test and Forward Test and Measure the Profit Factor
It is important to perform sufficient testing to understand the profitability of the strategy before using them on the live trades. Use multiple timeframes and symbols to perform a series of back tests and forward tests, and collect as much data as possible on the historical outcomes of the strategy.
Profit Factor of the strategy can be calculated by using a simple formula
Profit Factor = (Wins/Losses) X Risk Reward
Use Filters and Different Combinations
Filters will help us in filtering out noise and trade only the selective patterns. The filters can include a simple logic such as trade long only if price is above 200 SMA and trade short only if price is below 200 SMA. Or it can be as complex as looking into the divergence signals or other complex variables.
Other ideas for using filters includes considering trading volumes, price movements before the formation of patterns. Quality of trend lines identified and clarity of historical price directions.